Geospatial Competency Assessment - Educators & Practitioners
Introduction
This research study uses Q Methodology to assess the perceptions of respondents towards the core competencies contained within the National Geospatial Technology Center of Excellence (GeoTech Center) Geospatial Competency Matrix.
Problem Statement
Researchers have attempted over the last 20 years to capture the skills needed for workers to be successful in the geospatial field. Historically, there has been a lack of external input from practitioners and educators regarding their views towards geospatial competencies. What input there was did not force participants to discriminate between the relevance of the competencies.
Purpose Statement
The purpose of the study is to explore the viewpoints of practitioners and educators toward the GeoTech Center Geospatial Competency Matrix and why they hold these views. By assessing viewpoints toward these competencies, the researcher can better understand how they view core geospatial competencies.
Finding 1. This study revealed seven viewpoints, representing the different perspectives of practitioners and educators participating in the research project. The emergent factors were Factor 1: We are Cartographers (map evaluators); Factor 2: Vector Data is our Paramount Focus; Factor 3: Analysis is the Key to Addressing Geospatial Problems; Factor 4: Using Programming to Support Analysis; Factor 5: Where in the World is the Data; Factor 6: Data Refinements are a Critical Step in Spatial Analysis, and Factor 7: We have a Love/Hate Relationship with Data.
Finding 2. The Chi-Square and Fisher’s Exact Tests of Independence determined a relationship between the participants’ industry sector and the factors. The results were significant when the researcher conducted tests of Independence. The analysis revealed an X2 of 34.565, 18 degrees of freedom, and a p-value of > .0107 (significance level of 0.05). Recognizing the limitations of Chi-Square, a Fisher’s Exact Test was used, which yielded significant results having a two-sided probability of p ≤ .0011 and indicating that the association between the variables is statistically significant. These results reject the null hypothesis of the absence of a relationship between the industry sector and a shared perspective (factor).
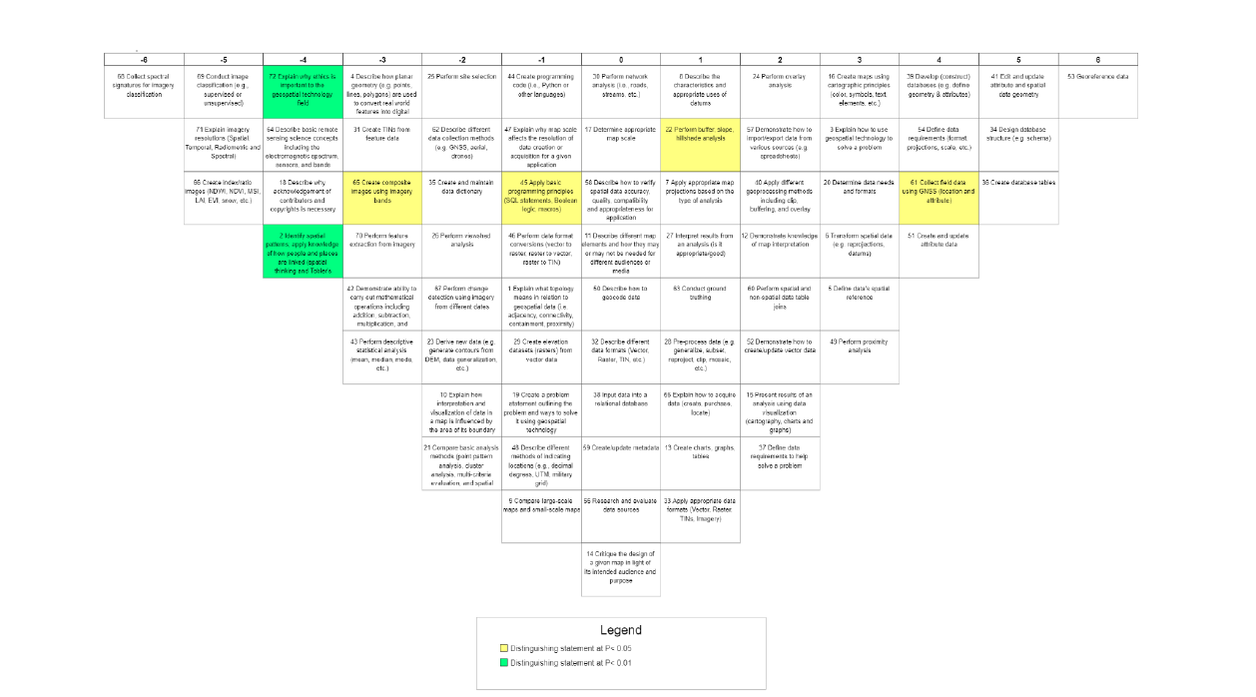
Finding 3. The respondents shared some general impressions regarding the perceived relevance of the statements located within the GeoTech Center Geospatial Competency Matrix. No competency cluster dominated the most relevant skills. However, positively viewed competency areas included using geospatial science to solve problems (Statements 3, 19, and 37, with a mean score of 0.83), spatial analysis (Statements 27, 49, and 24, with a mean score of 0.81), and database operations (Statements 39, 51, and 34), with a mean score of 0.65. The participants negatively viewed competency areas related to digital imagery and remote sensing, with seven statements falling in the bottom quarter of the array and three of the bottom four ranked statements. These competency statements, Statements 70, 69, 65, 64, 71, 66, and 68, were deemed less relevant to the geospatial field, with a mean value of -0.86.
Conclusion
The researcher collected data from 70 practitioners and educators, with 47 respondents loading onto seven factors. The study gathered demographic, Q-sort (quantitative), and narrative (qualitative) data. This study represented the results of an investigation to address how practitioners and educators view the geospatial competency statements located within the GeoTech Center Geospatial Competency Matrix.
The study discovered no consensus statements. The researcher performed factor analysis on the Q-sort submissions and generated seven factors. The themes developed from the analysis include Factor 1: We are Cartographers (map evaluators); Factor 2: Vector Data is our Paramount Focus; Factor 3: Analysis is the Key to Addressing Geospatial Problems; Factor 4: Using Programming to Support Analysis; Factor 5: Where in the World is the Data; Factor 6: Data Refinements are a Critical Step in Spatial Analysis. Also, the investigation revealed distinctly negative opinions about peripheral disciplines' relevance (remote sensing and digital imagery).
The research indicated that a relationship existed between the participants’ industry sector and the factors with an X2 of 34.565, 18 degrees of freedom, and a p-value of > .0107 (significance level of 0.05). Recognizing the limitations of Chi-Square, a Fisher’s Exact Test was used as well. The results were also significant, with a two-sided probability of p ≤ .0011, demonstrating that the association between the variables is statistically significant.
This research study validates using a Q Methodological study as a practical approach to examining the statements within a competency model. Moreover, it demonstrated a process using industry representatives to evaluate a conceptual model of competencies.


